Design for Dimensions
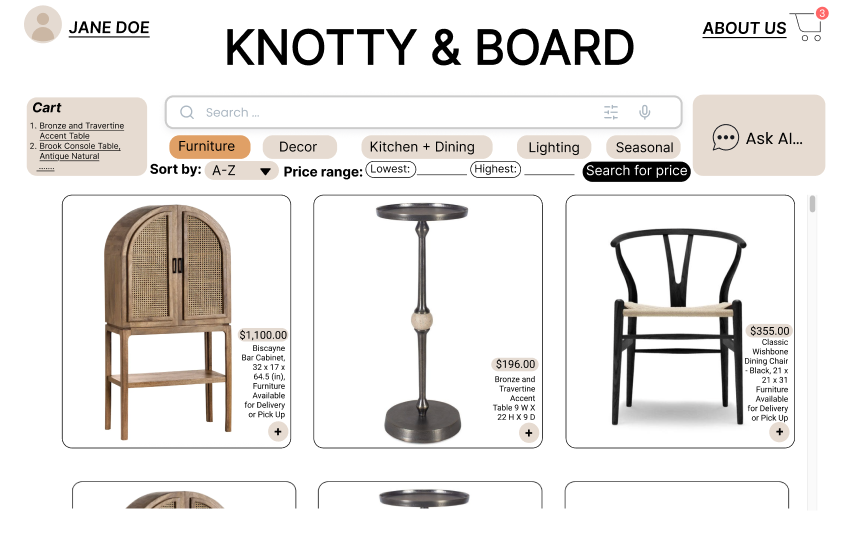
Worked in a team of three to redesign Knotty & Board's homepage and shopping page for elderly users, conducting interviews and usability tests with Davidson College students.
Human-centered design sprints and interactive data visualizations from CSC 363 and CSC 362 — user research, prototyping, d3.js, and immersive VR experiences.
Worked in a team of three to redesign Knotty & Board's homepage and shopping page for elderly users, conducting interviews and usability tests with Davidson College students.
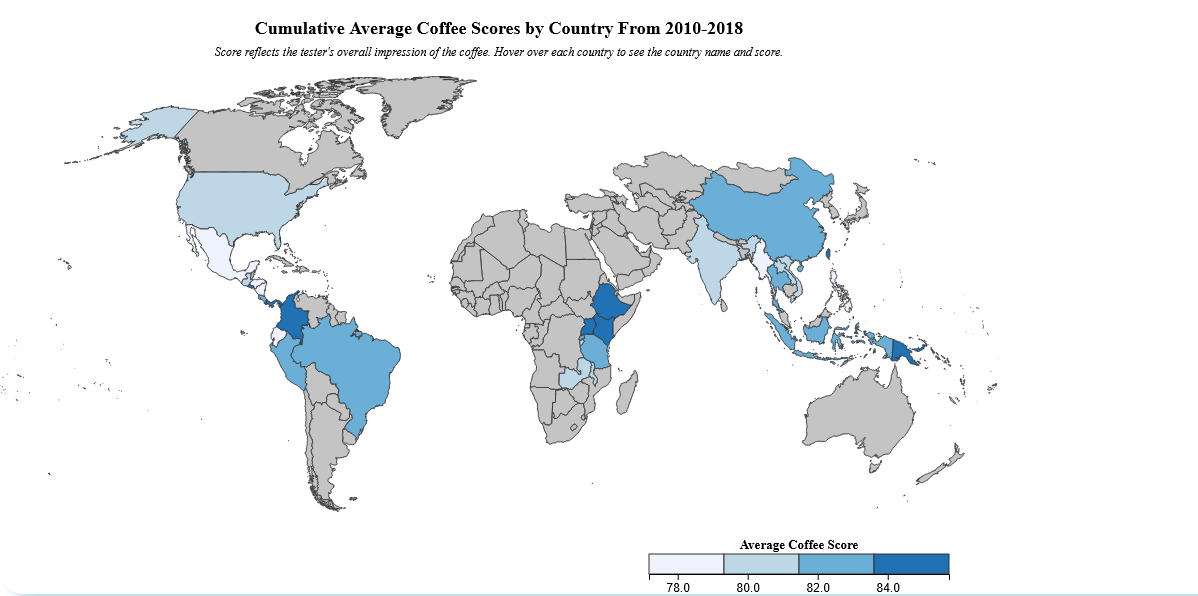
Converted a coffee dataset into accessible visualizations using d3.js: a bar chart of characteristics, a choropleth map of global distribution, and a pie chart of production by nation.
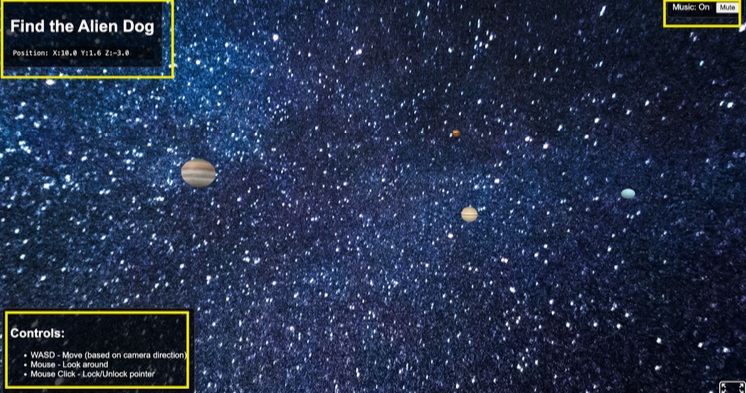
Built an interactive space-exploration game in A-Frame — created the environment, implemented movement and physics, and designed interactive features for an immersive VR experience.
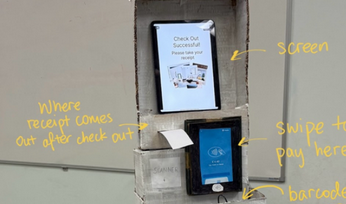
Transformed a Figma prototype into a physical kiosk with tactile interaction. Conducted usability testing and refined designs to support in-person shopping workflows.
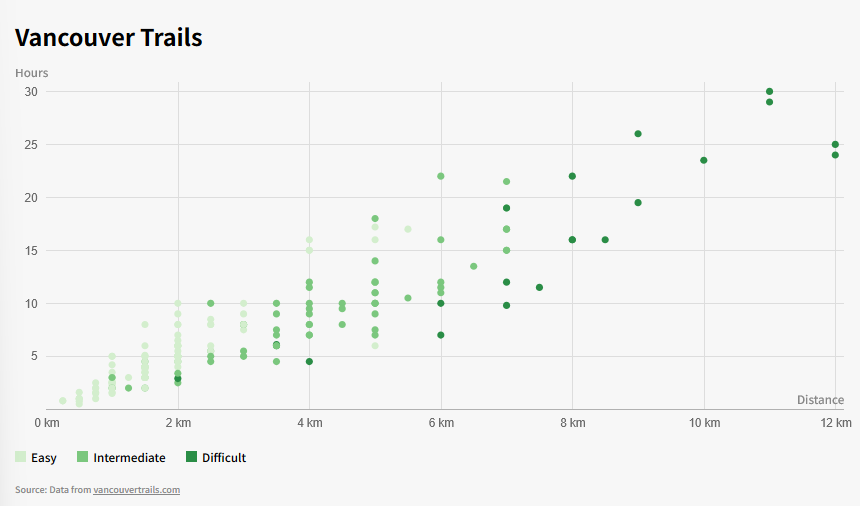
Responsive scatterplot of Vancouver hiking trails by difficulty and distance. Built with d3.js and designed to adapt across screen sizes and device dimensions.
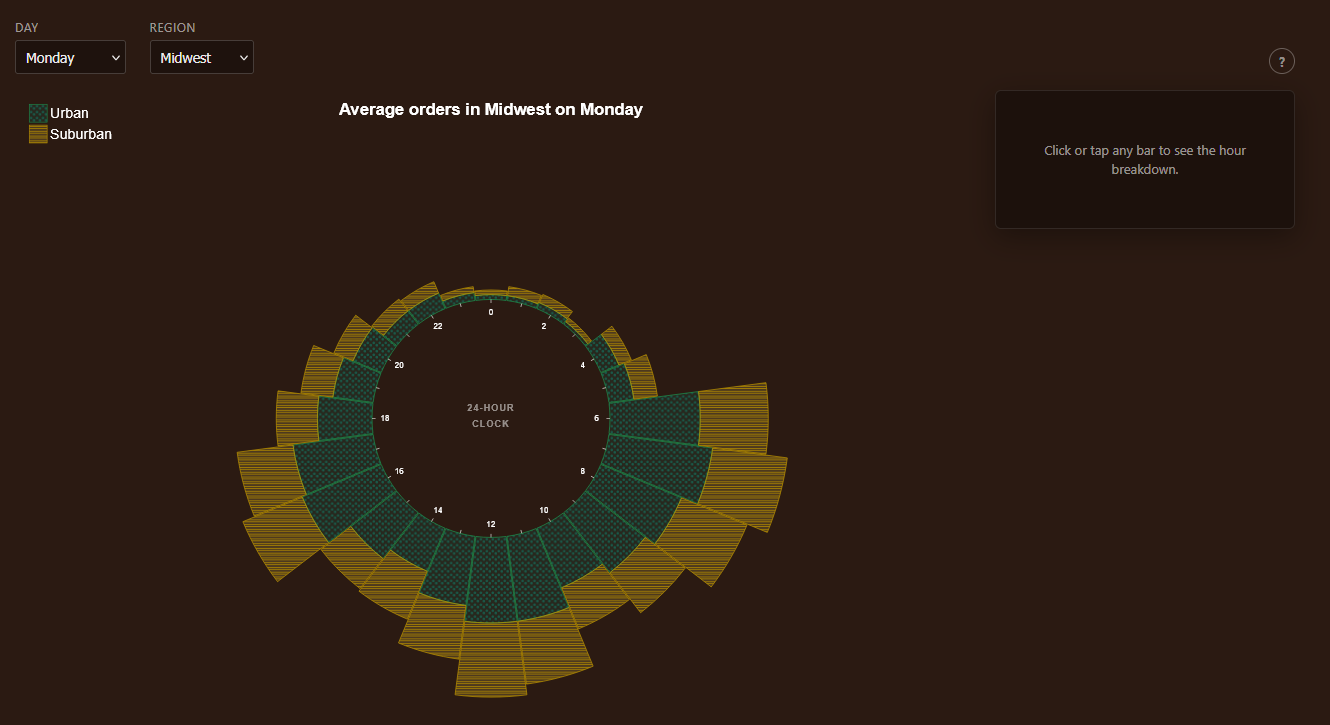
Surfaced cyclical order patterns across 24 hours and four U.S. regions with a keyboard-accessible D3.js radial chart, live filters, and hour-level breakdown panels.